
As a user configuring a Personal Report, you can now see a preview of your configured chart and settings, so that you can verify the visual data representation before saving the report.
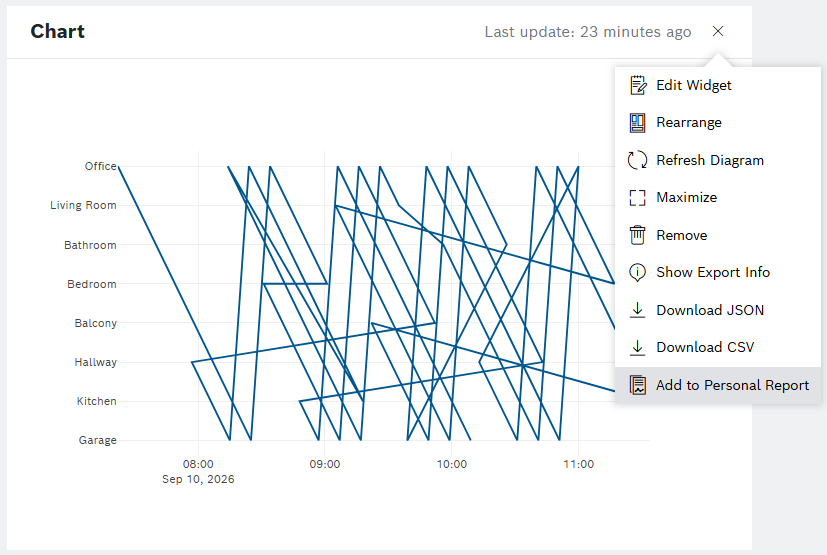
From the dropdown of your Chart widget, select the ‘Add to Personal Report’ option:
In the ‘Add new topic to a report’ dialog that opens, you can define the region’s settings in the mandatory fields of Axis and Value, and optionally, in the Line Color and Background Color fields.
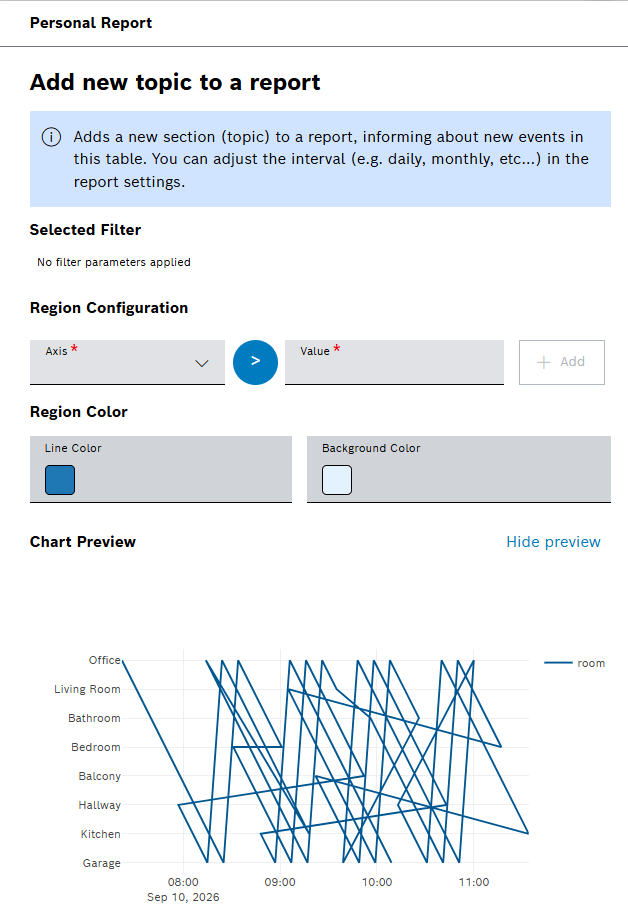
The Chart Preview responds dynamically to your changes.
A permanent disclaimer is provided below the Chart Preview section:

To learn more about Chart widgets, refer to Chart widgets guide.